Follow me on Twitter for my intraday comments @dacenergy
Tel: 646-202-1433 Email: dchirichella@mailaec.com
This week showed another above normal withdrawal from inventory with a new bout of artic air heading to the lower forty eight. After a week of warmer than normal temperatures starting early next week another round of bitter cold is heading to the eastern half of the US which will result in the inventory deficit gap widening further and putting the industry in a challenging position to get inventories back to normal levels by the start of the next winter heating season.
So the big question facing the industry is will inventories build strongly enough during the normal seasonal injection period to get the level back to where it was at the start of this year’s winter season. Right now the way the market is trading in the front end of the forward curve suggests that the industry (or at least the spec community) is starting to develop a view that this year’s inventory injection season will come up short by the start of the upcoming winter heating season.
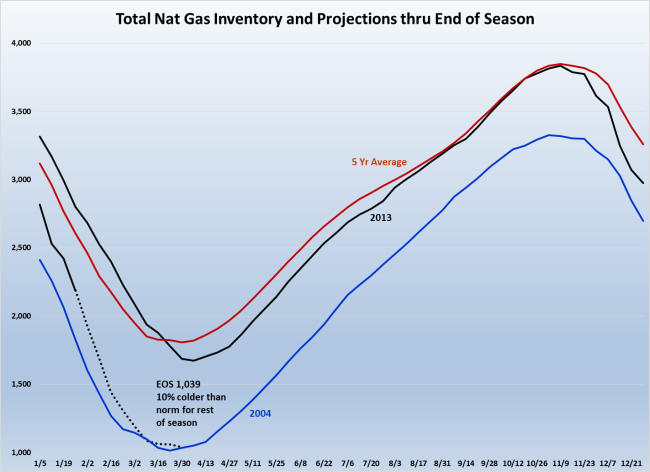
This week’s inventory withdrawal of 250 BCF sent my projection for the end of season (EOS) inventory level down to about 1,039 BCF and just about where the season ended in 2004 as shown in the following chart. Obviously there are strong differences in the level of production now versus 2004 as well as the demand level for both of these years.
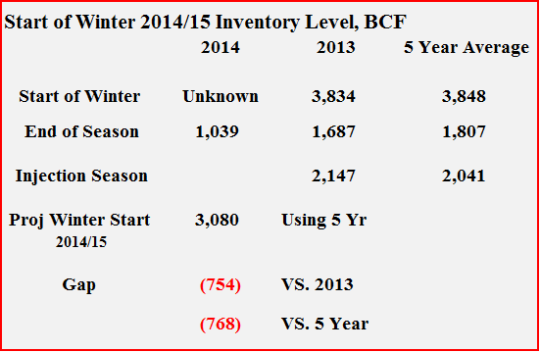
The following table compares the projected end of season inventory level this year with both last year and the five year average. In addition the table compares the total projected inventory level heading into the upcoming winter heating season (2014/15) using the five year average injection level applied to the projected end of season level for this year.
This comparison suggests that the industry is likely to have a huge challenge in getting back to a comfortable pre-winter inventory level. Whether I compare the projected start of the 2014/15 winter level to last year or the five year average there is still a huge gap that will have to be made up. With the EIA projecting total US production to increase about 2.2 percent this year over last year I am not certain that the industry is will be able to get to the five year start of winter level this year.
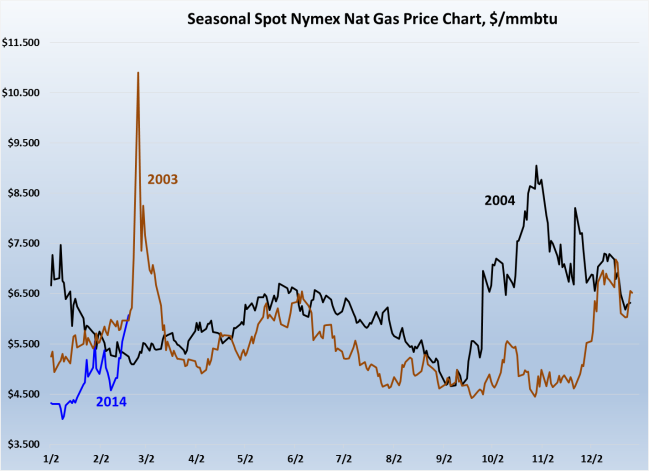
That said the following chart shows prices on a seasonal basis compared today’s spot futures price with where it was back in 2004 and 2003. As shown in the chart today’s spot price is already well above 2004 and on a similar path as in 2003 when the end of season inventory level came in about 30 percent below where my current EOS projection is.
The current price trend is evolving like 2003 and 2004 suggesting that the market is starting to form a view that the industry may not be able to rebuild inventories at a fast enough rate and get back to even last year’s start of winter level especially if the upcoming summer cooling season turns out to be hotter than normal and the hurricane season is more active than normal especially in the Gulf of Mexico.
This short analysis suggests to me that the Nat Gas futures market is not heading for a sustainable downtrend anytime soon. Yes there will be several downside corrections once the market is convinced that the winter weather is finally over (even possibly before). However, I do not expect any selling to be long lasting and to be relatively shallow. Fundamentals will likely play a much stronger role in price direction for the rest of this year.
From a trading perspective I would expect the trading community to initiate timing spreads across next winter during downside correction phases. In addition I would strongly recommend that the Nat Gas hedging community also begin to look for windows of opportunity to start to set next winter’s hedges during downside corrections. Using option hedging strategies could be the way to go once volatility starts to decline toward more normal historical levels.
I will be updating these tables and my analysis only in my daily Natural Gas Market Analysis newsletter and likely add a few more data points on a weekly basis to coincide with new data releases by the EIA.
I invite you try a FREE TRIAL of my newsletter by going HERE.


