By Dominick A. Chirichella
Follow me on Twitter for my intraday comments @dacenergy
tel: 646-202-1433 email:dchirichella@mailaec.com
With the Keystone Gulf Coast pipeline running smoothly and slowly ramping up to its design capacity a serious volume of oil is starting to be moved from Cushing down to the US Gulf Coast. For about a month or so the Gulf Coast has been on my radar as well as on the mind of many in the industry insofar as the disposition of crude oil in the greater PADD 3 region. The main question(s) in the market… will a surplus of crude oil build in the Gulf as large volumes of crude oil are moved from the Cushing area and what are the implications on the major inter-market spread relationships? Just last week alone the Keystone Gulf Coast Pipeline pumped at a rate of about 243,000 bpd of oil to the US Gulf (as reported by Genscape) or about 1.7 million barrels for the week.
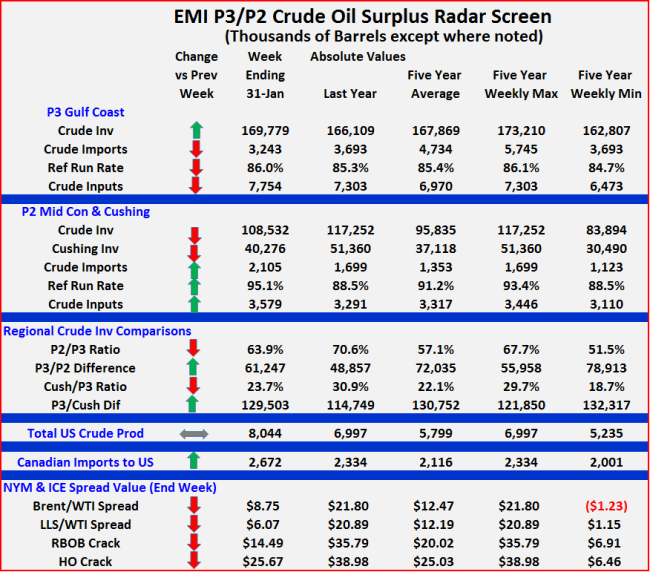
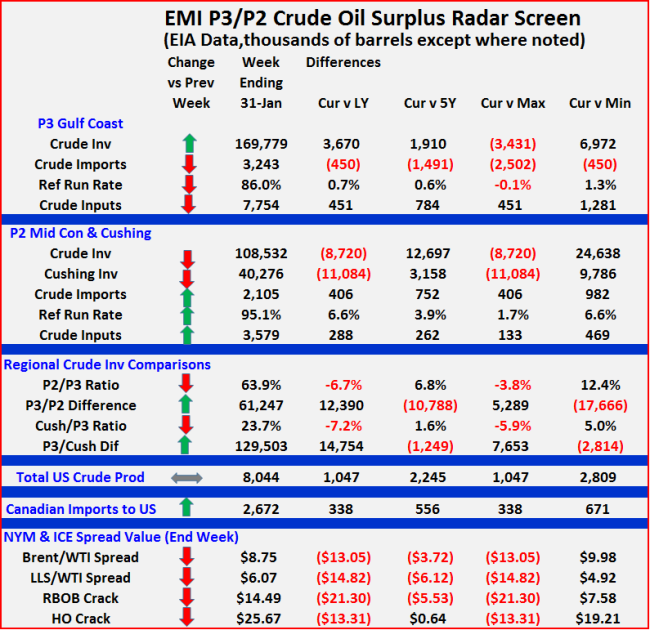
The following set of tables is a summary of some of the major data points that are important in addressing the aforementioned questions from a US fundamental perceptive. There are two tables… the first table shows the data in absolute terms while the second table compares the current data points to various historical benchmarks. The first table… EMI P3/P2 Crude oil Surplus Radar Screen highlights Inventory levels, crude oil Imports, refinery inputs and run rates for both PADD 3 and PADD 2, Cushing inventory levels, a regional comparison, total US crude oil production, Canadian crude oil imports and several inter-market spread relationships. Following are the main highlights from this analysis.
- PADD 3/US Gulf Coast
– Crude oil stocks have built strongly for the last three weeks in a row and are now above both last year and the five year average but below the highest level for the same week over the last five years.
– Crude oil imports have been steadily declining into the Gulf Coast and are currently below the lowest level for the same week over the last five years.
– The robust US crude oil production rates are continuing to back out imports.
– Refinery run rates in the Gulf are still near the higher end of the normal range for this time of the year as the refinery maintenance season seems to be starting a bit later that normal.
– Overall the Gulf region is within the normal fundamental operating range for this time of the year but there is not a large cushion in the deficit gap between the current inventory level and the five year maximum level.
– The key data point to watch close is the rate of inventory build this season as compared to the build rate for the five average. The average weekly build shown by the five year average between this week’s report and the end of April is about 1.6 million barrels per week for a total build of about 19 million barrels.
- PADD 2/Cushing
– Both PADD 2 and Cushing crude oil stocks are running below last year at this time but are still above the five year average level for the same week.
– Crude oil imports into the region have been steadily increasing in contrast to the steady decline in imports into the Gulf area.
– The increase in imports into PADD 2 is primarily coming from Canada which has seen its imports to the US steadily grow versus all of the historical benchmarks shown in the table.
– Refinery run levels and crude oil inputs to refineries are all noticeably higher than last year as well as the five year average as refinery margins in the region remain robust due to the deep discount for heavy Canadian crudes with the refinery maintenance yet to get underway.
- Regional Crude Comparisons
– I have used two measures to gauge the relationship between crude oil inventories in the various regions as a macro estimate of flow between the regions.
– First the ratio of the PADD2 to PADD 3 crude oil inventory level is currently running at 63.9 percent and lower than last year as PADD 2 inventories declined year on year while PADD 3 stocks increased.
– The same can be said for the ratio of Cushing stocks versus PADD 3.
– The same conclusions can also be draw when looking at the difference in inventory levels between the various regions as shown in the table.
- Spread Valuations
– With Cushing inventories declining by over 20 percent on a year on year comparison the Brent/WTI spread has narrowed by about $13.05/bbl versus last year.
– The spread is also below the five year average as it slowly moves toward a more a historical relationship that existed prior to the crude oil surplus build-up in the Cushing area.
– The LLS/WTI spread has been consistently following the direction of the Brent/WTI spread narrowing by $14.82 versus last year and even more strongly than the Brent/WTI spread. As the LLS/WTI spread continues to narrow it will certainly impact the economics of moving light oil in particular by rail to the US Gulf Coast.
– Refinery margins measured by the Nymex oil commodities for both RBOB and HO are well off of the levels enjoyed last year by the refining sector… especially those in PADD 2 and compared to the five year average as WTI firms relative to Brent as well as refined products. The normalization of crack spreads is also in play and will continue to adjust as the Brent/WTI spread narrows further.
Overall, there is still no significant surplus of crude oil in the Gulf region but with close to several million barrels per week (and rising) of crude oil moving out of the Cushing area to the Gulf the exposure is certainly moving into the forefront. Going forward Cushing stocks are likely to move closer to their pre-surplus levels at a time when the Gulf region will be in the midst of its normal spring maintenance season. It is not a matter of will a crude oil surplus form in the Gulf but rather when, to what degree and how long will it last.
Over the longer term I am still expecting the Brent/WTI spread to narrow but over the next few months as Keystone continues to ramp up while refiners undergo maintenance the spread will be volatile and like have difficulty in narrowing strongly until refineries are back to normal seasonal operating levels toward the end of April and into May.
I will be updating these tables and my analysis only in my daily Energy Markets Analysis newsletter and likely add a few more data points on a weekly basis to coincide with new data releases by the EIA. I invite you try a free trial of my newsletter here.


